
What is big data?
Big data is a large volume of structured or unstructured data. It includes any data set that is either too large or too complex to process using traditional methods. Big data was originally defined by Doug Laney as the ‘three V’s’: volume; velocity; and variety.
What are the challenges?
Gathering data itself is usually straightforward. There are many cheap ways and devices to collect it. However this also means that the data set can grow rapid. This presents the challenge of storing, analysing and searching the material.
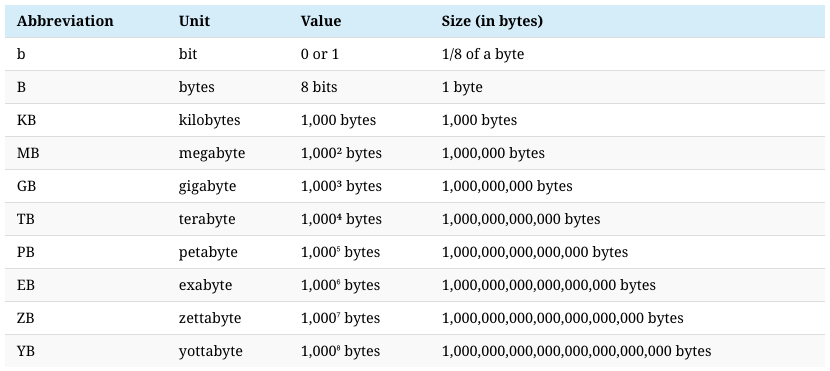
The World Economic Forum predicts that the entire digital universe is expected to reach 44 zettabytes by 2020.
How is it useful?
Any data set can be of use to an organisation. It could be emails or phone calls. However the larger the data set the better the statistical value. Analysis of big data provides insights that facilitate better decision making or determine the reason for failures. For example, it can help spot trends, provide business intelligence and identify correlations. Indeed, the data management and analytics industry is worth more than $100 billion and is still growing.
Who is using big data?
Almost every industry is using the information that it collects in its day to day activities to provide further insight and analysis. Some of the most common examples include:
Healthcare: Patient records can be used to identify health conditions, trends and help optimise treatments
Media: Posts and content is used extensively in analysing social media, understanding customer behaviours and in the targeting of consumers in relation to products and offers.
Financial Services: Unusual patterns in customer transactions can be used to identify potential fraud or spotting trends.
Public Sector: Governments regularly collect public statistics to drive efficiencies at the local and national level and help drive policy making.
What are the best tools for analysing data?
The best tools will depend on the type of information that you want to analyse. For example, are you looking at trends in the weather or the frequency of a particular keyword in your business communications?
Whatever it is, you will need some form of computer software to help you understand it all. By definition, the volume of material is too complex to process using the usual procedures. However, there are some common features which you should look for when evaluating tools.
Speed: With huge quantities of data, you should to see how long it will take to generate your desired output. This can also affect the cost so think carefully if you need the data in real time or if you can wait a bit longer to get the answers you need. For example, if you are analysing call transcripts, a call transcription service that has a 3 hour turnaround will usually be cheaper than one that has an immediate turnaround.
Filters: The ability to filter, sort and search your records is important. Some tools limit what users can filter and often the information generated is not accurate. It therefore follows that having filters can improve your search results.
Adoption: Users often prefer to work with tools that seamlessly integrate with their exiting systems. For example if you are looking to analyse your emails, it is better to use a tool that can interact directly with your email client rather than having to set up tags or rules.